m-no-circle
Forrester Research

Customer Experience Maps

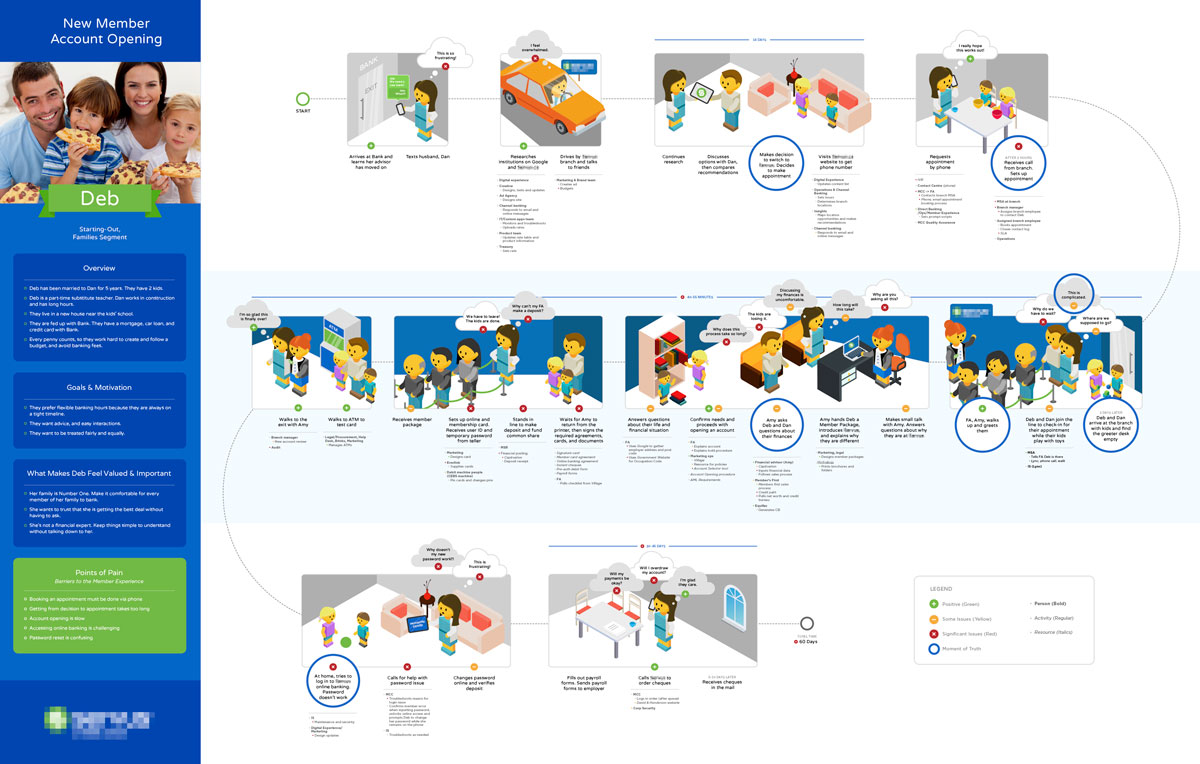
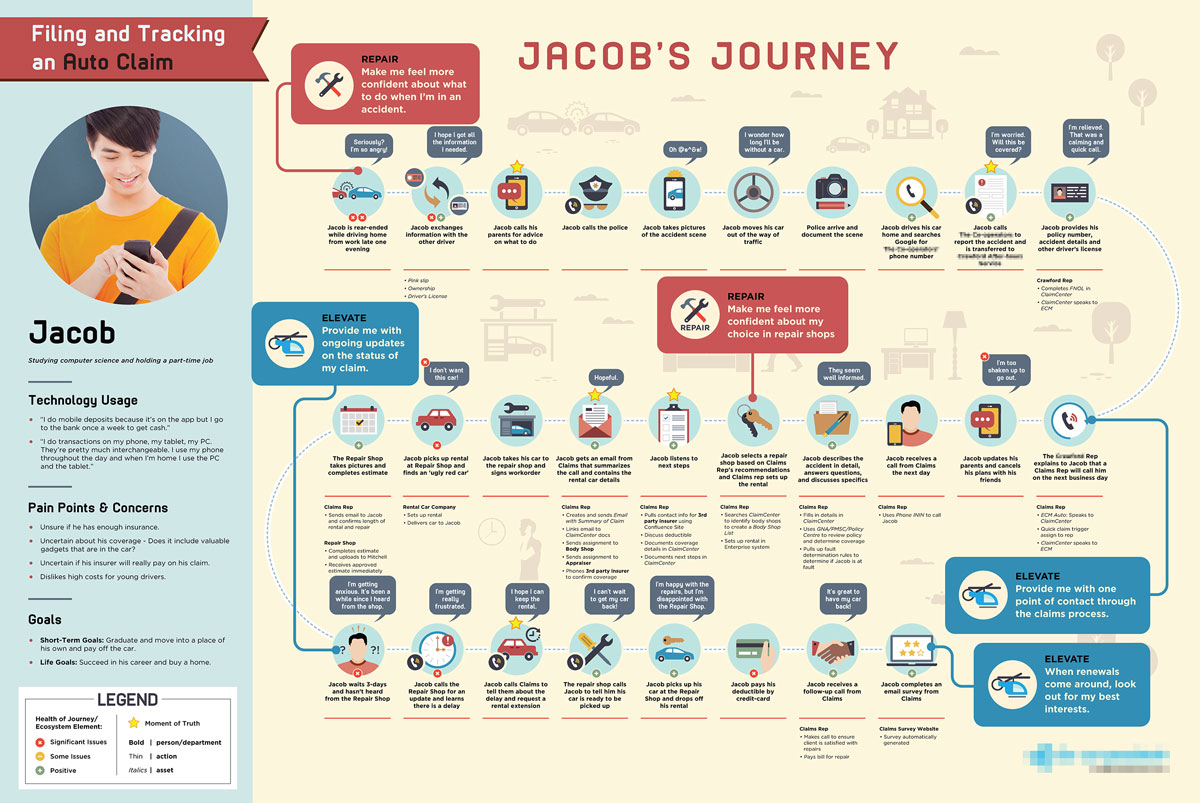
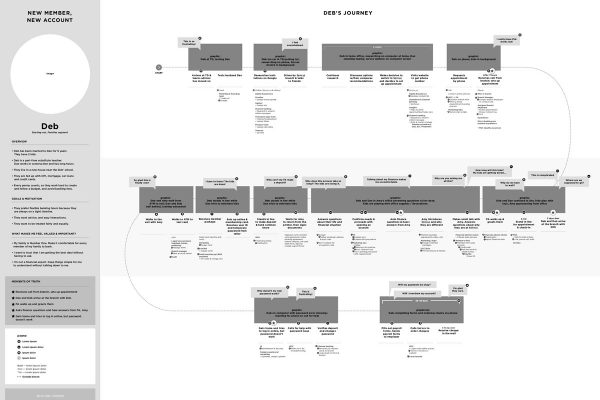
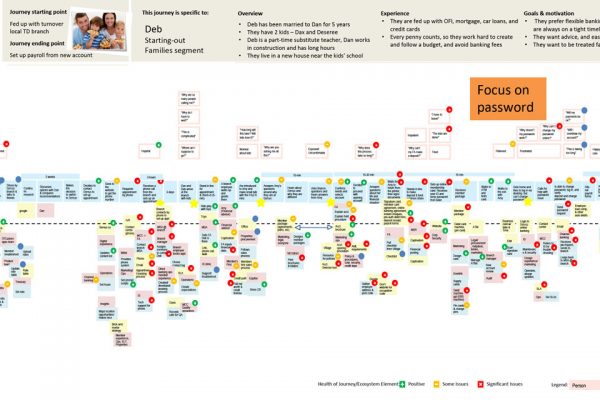
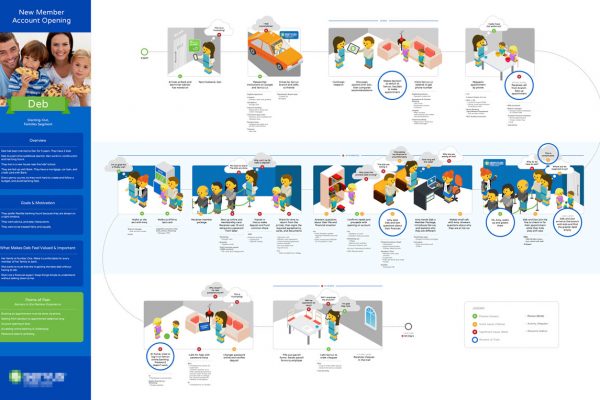
We partnered with Forrester Research to visualize customer journeys for their clients. We synthesized Forrester’s research (from post-it note covered walls and whiteboards, to powerpoint decks and spreadsheets) we designed these Journey Maps that convey the ups and downs of the customer experience and identify the pain points and successes along the way.

STORYTELLING WITH DATA

Visualizing a Customer’s Experience

Illustrating the customer experience allows stakeholders from all areas of the business to better understand the essence of the whole organization from the customer’s perspective. How do they want to be spoken to, what are they thinking, feeling, seeing, hearing, and doing? Journey maps allow us to explore answers to the “what ifs” that arise during research and conceptual design.