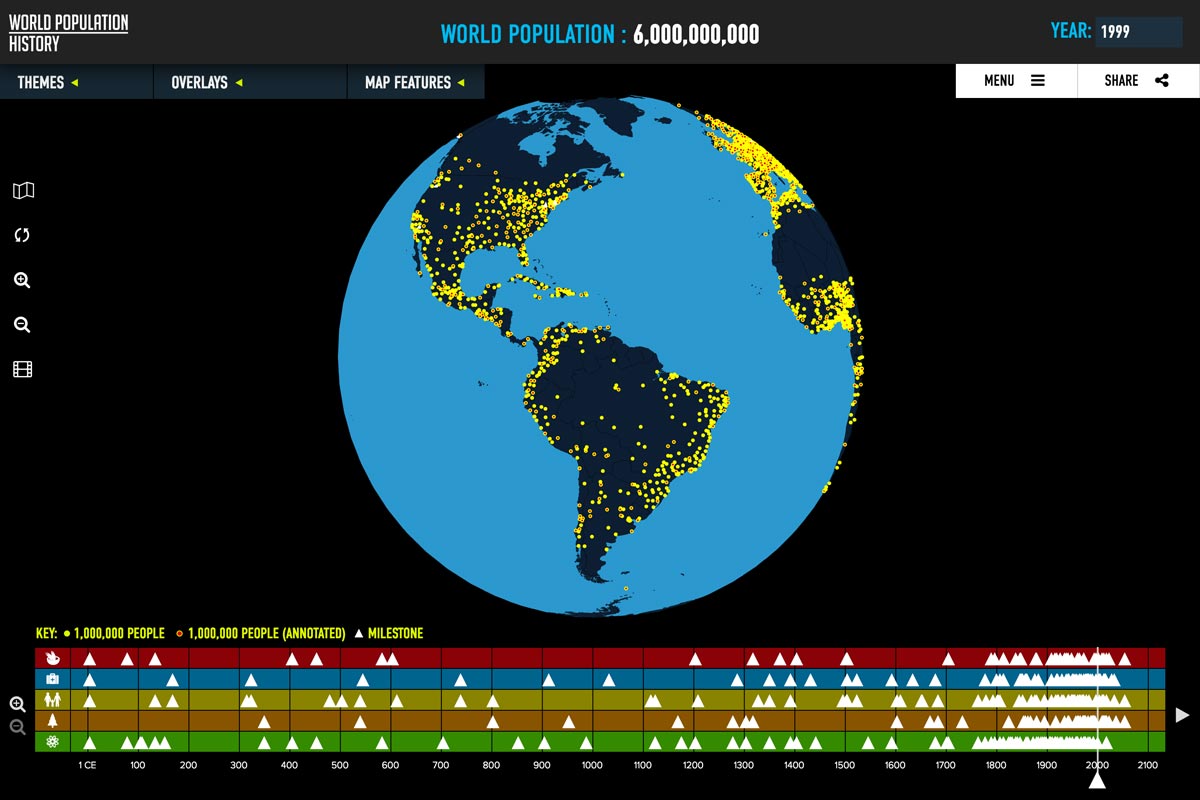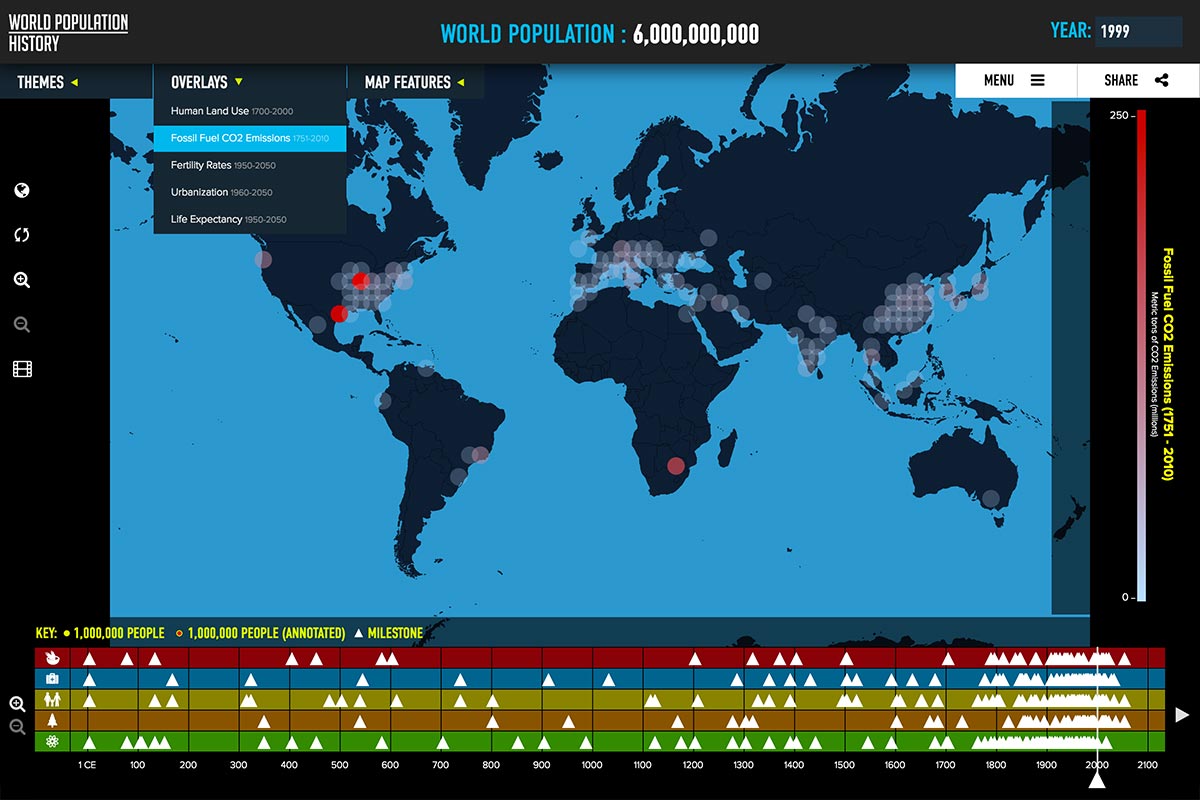
The capacity of our environment to provide space, to produce food, and to supply energy are all limited. Our population is expected to grow to 10 billion by the end of this century, yet the Earth’s size remains the same. Explore population growth from 1 C.E. to 2050 on the map as dots representing concentrations of one million people. Learn about important milestones in human history and view other key data including land use, fertility rates, CO2 emissions, life expectancy, and urbanization.
For the latest edition of this experience, Population Connection turned to Manteca to develop an interactive version of the map. We designed and developed this application that allows users to get a much deeper look at the effect population growth has had on our planet and our civilization.
Now users can discover more about the trends that have shaped population growth. They can zoom into the population map to learn more about the places illuminated by the dots and select different overlays for the map to see the impacts of human lifestyles over time.
Working with Population Connection’s subject matter experts, we reviewed thousands of data sets, and curated information from an array of sources including the United Nations, The US Census Bureau, National Geographic, ESRI, and dozens more.
We then wireframed the application and developed a clickable prototype that allowed us to test the experience before a line of code was written. Next we applied a design that had to present layers of complex data in a clear and concise way.
Finally, our team of talented engineers developed this experience. An undertaking involved plotting more than 10,000 population-related data points, and creating a manageable backend interface from which admins can add and edit.